How Spot Markets, Perpetual Futures Markets, and Market Makers Interact
A comprehensive guide explaining the relationship between spot and perpetual futures markets, how market makers profit through arbitrage, funding, fees, spread capture, liquidity provision, and inventory management. Essential reading for understanding modern crypto market microstructure.
How Spot Markets, Perpetual Futures Markets, and Market Makers Interact
Traders often ask a fundamental question: which market is more important for price prediction—spot or perpetual futures? The answer reveals a complex relationship where these markets continuously influence each other through the actions of market makers, arbitrageurs, and liquidity providers. This article explores how spot and perpetual futures markets interact, why futures often lead spot price movements, and how market makers generate profit through multiple sophisticated mechanisms including arbitrage, funding rates, fees, spread capture, liquidity provision, and inventory management. Understanding this system is essential for anyone seeking to comprehend modern cryptocurrency market microstructure and the forces that drive price discovery.
1.Definitions: Understanding the Building Blocks
Before diving into how these markets interact, it’s essential to understand the fundamental components of the system. Each element plays a specific role in the broader market structure, and their definitions reveal why they behave the way they do.
Spot Market
A spot market is where real cryptocurrency assets are bought and sold for immediate settlement. When you buy KAS on a spot market, you’re purchasing actual KAS tokens that are transferred to your wallet or exchange account. Settlement happens immediately or within a few days, and you own the underlying asset. Spot markets are used for actual ownership, real transactions, and physical delivery of coins. The price on spot markets represents the current market value of the actual asset.
Spot markets are essential because they represent the “real” market where actual coins change hands. However, in modern cryptocurrency trading, spot markets often have lower volume than derivatives markets, which creates interesting dynamics we’ll explore later.
Perpetual Futures Market
A perpetual futures market (often called “perps”) trades synthetic contracts that represent a cryptocurrency’s price without requiring ownership of the underlying asset. Unlike traditional futures contracts that expire on a specific date, perpetual futures never expire—hence “perpetual.” These contracts allow traders to take long positions (betting the price will rise) or short positions (betting the price will fall) with leverage, meaning they can control large positions with relatively small amounts of capital.
The key mechanism that keeps perpetual futures prices aligned with spot prices is the funding rate. Every few hours (typically every 8 hours), traders holding long positions pay funding fees to traders holding short positions, or vice versa, depending on whether the perpetual price is above or below the spot price. This funding mechanism creates a continuous economic incentive for prices to converge, which is crucial for understanding how these markets interact.
Perpetual futures markets have become dominant in cryptocurrency trading because they offer leverage, don’t require holding actual coins, and provide 24/7 trading opportunities. This dominance means they often drive price discovery, with spot markets following their lead.
Market Makers (MMs)
Market makers are professional trading firms or individuals who provide liquidity to markets by continuously quoting both buy and sell prices. They are liquidity providers, arbitrageurs, and risk-neutral participants who profit from market inefficiencies rather than directional price bets. Market makers don’t typically hold strong directional views—instead, they profit from small price differences, execution speed, and providing services that markets need.
Market makers operate sophisticated automated systems that monitor multiple exchanges simultaneously, execute trades in milliseconds, and maintain delta-neutral positions (positions that aren’t exposed to directional price risk). They have access to colocated servers, preferential fee structures, and large capital reserves that allow them to capture opportunities retail traders cannot.
The presence of market makers is essential for market efficiency. Without them, price gaps would persist longer, spreads would be wider, and arbitrage opportunities would remain uncaptured. However, their sophisticated operations also mean they capture most of the profit opportunities that exist in the gap between spot and futures markets.
Arbitrage
Arbitrage is the practice of simultaneously buying and selling correlated assets to capture price imbalances. In the context of spot and perpetual futures, arbitrage occurs when there’s a price difference between the two markets. For example, if KAS spot is trading at $0.051 and perpetual futures are trading at $0.053, an arbitrageur can short the futures (sell at $0.053) while buying spot (buy at $0.051), locking in a $0.002 profit per coin regardless of which direction the price moves.
Arbitrage requires large capital, high execution speed, and sophisticated infrastructure because price gaps disappear within milliseconds as thousands of automated systems compete to capture them. The profit margins are extremely small—often just a few basis points—but when executed at scale with high frequency, these small margins compound into significant profits.
Arbitrage is the primary mechanism that forces spot and futures prices to converge. When a gap appears, market makers immediately trade to capture it, and their trading activity pushes the prices back together. This happens so quickly that retail traders rarely see these opportunities—by the time a human notices a price gap, it’s already been arbitraged away.
Funding Rate
The funding rate is a periodic payment mechanism in perpetual futures markets that ensures perpetual prices track spot prices. Every 8 hours (or whatever interval the exchange uses), if perpetual futures are trading above spot, long positions pay short positions. If perpetual futures are trading below spot, short positions pay long positions. The funding rate is calculated based on the price difference and is typically expressed as an annualized percentage.
This mechanism creates a continuous economic incentive for prices to converge. If perpetuals are too expensive relative to spot, the funding rate makes it expensive to hold long positions, encouraging selling pressure on perpetuals and buying pressure on spot until prices align. Market makers often position themselves to collect funding payments while maintaining delta-neutral exposure, turning funding rates into a revenue stream.
Funding rates can be positive (longs pay shorts) or negative (shorts pay longs), and they fluctuate based on market conditions. During strong bull markets, funding rates are often highly positive as traders rush to long positions, creating opportunities for market makers to collect funding by holding short positions while hedging with spot.
Spread
The spread is the difference between the bid price (what buyers are willing to pay) and the ask price (what sellers are willing to accept) in an order book. A tight spread indicates high liquidity and efficient markets, while a wide spread indicates low liquidity or high volatility. Market makers profit from spreads by continuously quoting both sides—they buy at the bid and sell at the ask, capturing the difference thousands of times per day.
For example, if the bid for KAS is $0.05100 and the ask is $0.05105, the spread is $0.00005 (5 basis points). A market maker might buy at $0.05100 and immediately sell at $0.05105, capturing $0.00005 per round trip. When executed thousands of times with large volumes, these micro-profits accumulate into significant revenue.
Spreads are dynamic and respond to market conditions. During high volatility or low liquidity events, spreads widen, creating both risk and opportunity for market makers. Their ability to provide liquidity during these times is valuable to exchanges and traders, which is why exchanges offer maker rebates to incentivize market making.
Order Book Liquidity vs. Forced Liquidity (Liquidations)
Order book liquidity refers to the depth of buy and sell orders available at various price levels. Deep order books with many limit orders at tight spreads indicate healthy liquidity. Market makers provide much of this liquidity by continuously placing limit orders on both sides of the book.
Forced liquidity, on the other hand, comes from liquidations—when leveraged positions are automatically closed by exchanges because they’ve lost too much value or can’t meet margin requirements. Liquidations create sudden, large market orders that must execute immediately, regardless of price. These forced trades provide liquidity in a different way: they create volume and price movement, but they’re not the same as the orderly limit orders that make up normal order book liquidity.
Market makers benefit from both types of liquidity. Order book liquidity allows them to execute their strategies efficiently, while liquidation events can create temporary price dislocations that create arbitrage opportunities. However, liquidations can also create volatility that makes market making riskier, requiring sophisticated risk management.
Why Crypto Relies Heavily on Derivatives
Cryptocurrency markets have evolved to rely heavily on derivatives (especially perpetual futures) for several reasons. First, derivatives allow traders to gain exposure without actually owning coins, which is appealing for regulatory, security, and capital efficiency reasons. Second, leverage amplifies trading opportunities, attracting more volume and participants. Third, derivatives markets often have better liquidity, tighter spreads, and more sophisticated trading infrastructure than spot markets.
This heavy reliance on derivatives means that price discovery—the process by which market participants determine the “true” price of an asset—often happens first in perpetual futures markets, with spot markets following. This is why understanding the relationship between these markets is crucial for traders.
What “Price Discovery” Means
Price discovery is the process by which markets determine the fair value of an asset based on supply, demand, information, and expectations. In efficient markets, price discovery happens continuously as new information arrives and traders adjust their positions. However, in cryptocurrency markets, price discovery is complicated by the existence of multiple markets (spot, perpetuals, various exchanges) that should theoretically have the same price but often have temporary divergences.
Market makers play a crucial role in price discovery by arbitraging away price differences and ensuring information flows quickly between markets. When news breaks or large orders arrive, market makers help propagate that information across all markets through their arbitrage activities. This makes price discovery more efficient but also means that retail traders often see price movements only after market makers have already captured the initial opportunities.
2.The Core Relationship: Why Futures Often Lead Spot
Understanding why perpetual futures markets often lead spot markets is fundamental to comprehending modern cryptocurrency price dynamics. This relationship isn’t accidental—it emerges from the structural characteristics of these markets and the behavior of their participants.
Higher Volume in Futures Markets
Perpetual futures markets typically have significantly higher trading volume than spot markets. This volume dominance means that more price-setting activity happens in futures markets. When large traders want to establish positions, they often do so in futures markets because of the leverage, liquidity, and 24/7 availability. This volume creates momentum that spot markets follow.
Higher volume also means that futures markets respond faster to new information. When news breaks or sentiment shifts, the first reactions often appear in futures markets because that’s where the most active traders and capital are concentrated. Spot markets, with their lower volume and slower participant base, tend to react to these futures movements rather than leading them.
This volume difference creates a feedback loop: futures lead because they have more volume, and they have more volume because traders go where the action is. This self-reinforcing dynamic means that understanding futures markets becomes essential for predicting spot price movements.
Leverage Amplifies Movements
Leverage in perpetual futures markets amplifies price movements. When traders can control $100,000 worth of exposure with only $10,000 of capital (10x leverage), their trading decisions have outsized impact on price. A relatively small amount of buying or selling pressure in leveraged markets can create significant price movements that then propagate to spot markets.
This amplification effect means that futures markets are more sensitive to sentiment, news, and trading flows. A bullish sentiment shift that might create a 2% move in spot markets could create a 5-10% move in futures markets due to leverage. These amplified movements in futures then create arbitrage opportunities that pull spot prices in the same direction.
The leverage effect also creates liquidation cascades—when leveraged positions get liquidated, the forced selling (or buying) creates additional price pressure that can trigger more liquidations. These cascades often start in futures markets and then affect spot markets as market makers hedge their exposure.
Market Makers Hedge Futures Exposure Using Spot
When market makers take positions in perpetual futures markets (either to provide liquidity or capture arbitrage), they typically hedge their exposure by taking opposite positions in spot markets. This hedging activity creates a direct link between futures and spot prices. If futures prices move up, market makers short futures and buy spot to hedge, which pushes spot prices up. If futures prices move down, market makers buy futures and sell spot, which pushes spot prices down.
This hedging mechanism is automatic and continuous. Market makers don’t want directional exposure—they want to profit from spreads, arbitrage, and funding rates while staying market-neutral. To achieve this neutrality, every futures position must be hedged with a corresponding spot position, creating constant trading flows between the two markets.
The scale of this hedging activity is enormous. Professional market makers trade billions of dollars worth of volume daily, and much of this volume represents hedging flows between futures and spot. These flows are what create the tight correlation between futures and spot prices, and they’re why spot prices follow futures movements so closely.
Arbitrage Forces Alignment
Arbitrage is the mechanism that ensures spot and futures prices cannot diverge significantly for long. When a price gap appears, market makers immediately trade to capture it, and their trading activity pushes prices back together. This happens so quickly—often within milliseconds—that sustained price divergences are rare.
However, the direction of arbitrage flows reveals which market is leading. If futures are leading (moving first), arbitrageurs will buy spot and sell futures, pushing spot up to match futures. If spot were leading (which is less common), arbitrageurs would buy futures and sell spot, pushing futures up to match spot. In practice, the former scenario is more common because futures markets have more volume and react faster to new information.
The arbitrage mechanism creates a one-way flow: futures move first, creating a gap, arbitrageurs trade to close the gap, and spot follows futures. This is why observing futures markets often provides better leading indicators for spot price movements than observing spot markets themselves.
Price Discovery Happens Mostly in Futures
Price discovery—the process of determining fair value based on all available information—happens primarily in futures markets because that’s where the most informed, active, and well-capitalized traders operate. Institutional traders, sophisticated algorithms, and market makers all concentrate their activity in futures markets, making these markets more efficient at incorporating new information.
When new information arrives—whether it’s news, technical developments, or changes in market sentiment—the first price reactions appear in futures markets. Spot markets, with their slower participant base and lower sophistication, then adjust to match the prices discovered in futures markets. This creates a clear directional relationship: futures discover prices, and spot follows.
This price discovery dominance means that traders who want to understand where prices are heading should pay close attention to futures markets. The open interest, funding rates, and price action in perpetual futures markets often provide better signals than spot market activity alone.
Spot Does Not Move Independently
A crucial insight for traders is that spot markets rarely move independently of futures markets. When you see spot prices moving, it’s usually because futures markets moved first, creating arbitrage pressure that pulled spot prices along. True independent spot movements—driven purely by spot market supply and demand without futures influence—are relatively rare in modern cryptocurrency markets.
This doesn’t mean spot markets are irrelevant. Spot markets still matter for actual coin ownership, real transactions, and long-term value. However, for short-term price prediction and understanding immediate market dynamics, futures markets provide more useful information because they lead the price discovery process.
Understanding this relationship helps traders avoid the common mistake of analyzing spot markets in isolation. The real action—the price discovery, the sentiment shifts, the large position changes—happens in futures markets first, and spot markets reflect those movements through arbitrage and hedging flows.
The Futures-First Dynamic
In modern cryptocurrency markets, perpetual futures markets typically lead spot markets in price discovery. This happens because futures have higher volume, leverage amplifies movements, market makers hedge between markets, and arbitrage ensures prices stay aligned. Understanding this relationship is essential for effective trading and market analysis.
3.The Convergence Mechanism: How Market Makers Force Price Alignment
The mechanism by which market makers force spot and futures prices to converge is both elegant and ruthless. Understanding this step-by-step process reveals why price gaps disappear so quickly and why retail traders rarely see arbitrage opportunities.
Step-by-Step: How Convergence Works
Let’s walk through a concrete example to see how market makers force price convergence. Imagine that KAS spot is trading at $0.051 while perpetual futures are trading at $0.053—a $0.002 gap that represents a potential arbitrage opportunity.
Step 1: A Price Gap Forms The gap might form because of a sudden surge in futures buying (perhaps due to leverage traders reacting to news), while spot markets haven’t yet reacted. At this moment, there’s a $0.002 difference between the two markets.
Step 2: Market Makers Detect the Gap Within milliseconds, automated systems operated by market makers detect this price discrepancy. These systems monitor multiple exchanges simultaneously, comparing spot and futures prices in real-time. The detection happens so fast that human traders would never notice the opportunity.
Step 3: Market Makers Short the Expensive Market Market makers immediately short perpetual futures at $0.053. They’re selling futures contracts, betting that the price will come down to match spot. This short position creates selling pressure on futures markets.
Step 4: Market Makers Buy the Cheap Market Simultaneously, market makers buy KAS on spot markets at $0.051. They’re acquiring actual coins at the lower price. This buying activity creates upward pressure on spot prices.
Step 5: Futures Selling Pressure Pushes Futures Down The market makers’ short positions in futures create selling pressure. As they sell futures contracts, the price begins to decline from $0.053 toward $0.051. Other traders see this selling and may join, accelerating the convergence.
Step 6: Spot Buying Pressure Pushes Spot Up The market makers’ buying activity in spot markets creates upward pressure. As they buy KAS coins, the spot price begins to rise from $0.051 toward $0.053. The increased demand pulls prices higher.
Step 7: Prices Converge Within seconds (or even milliseconds), the two prices meet somewhere in the middle—perhaps at $0.052. The gap has been eliminated through the market makers’ trading activity. At this point, the arbitrage opportunity no longer exists.
Step 8: Market Makers Unwind with Guaranteed Profit Once prices have converged, market makers can unwind their positions. They close their short futures position (buying back at the lower price) and sell their spot position (selling at the higher price). The difference—the original $0.002 gap minus fees—is their profit. This profit is essentially risk-free because the positions were hedged against each other.
This entire process happens so quickly that by the time a retail trader notices a price difference, it’s already been arbitraged away. The speed of this convergence is why understanding the mechanism is more valuable than trying to capture arbitrage opportunities yourself.
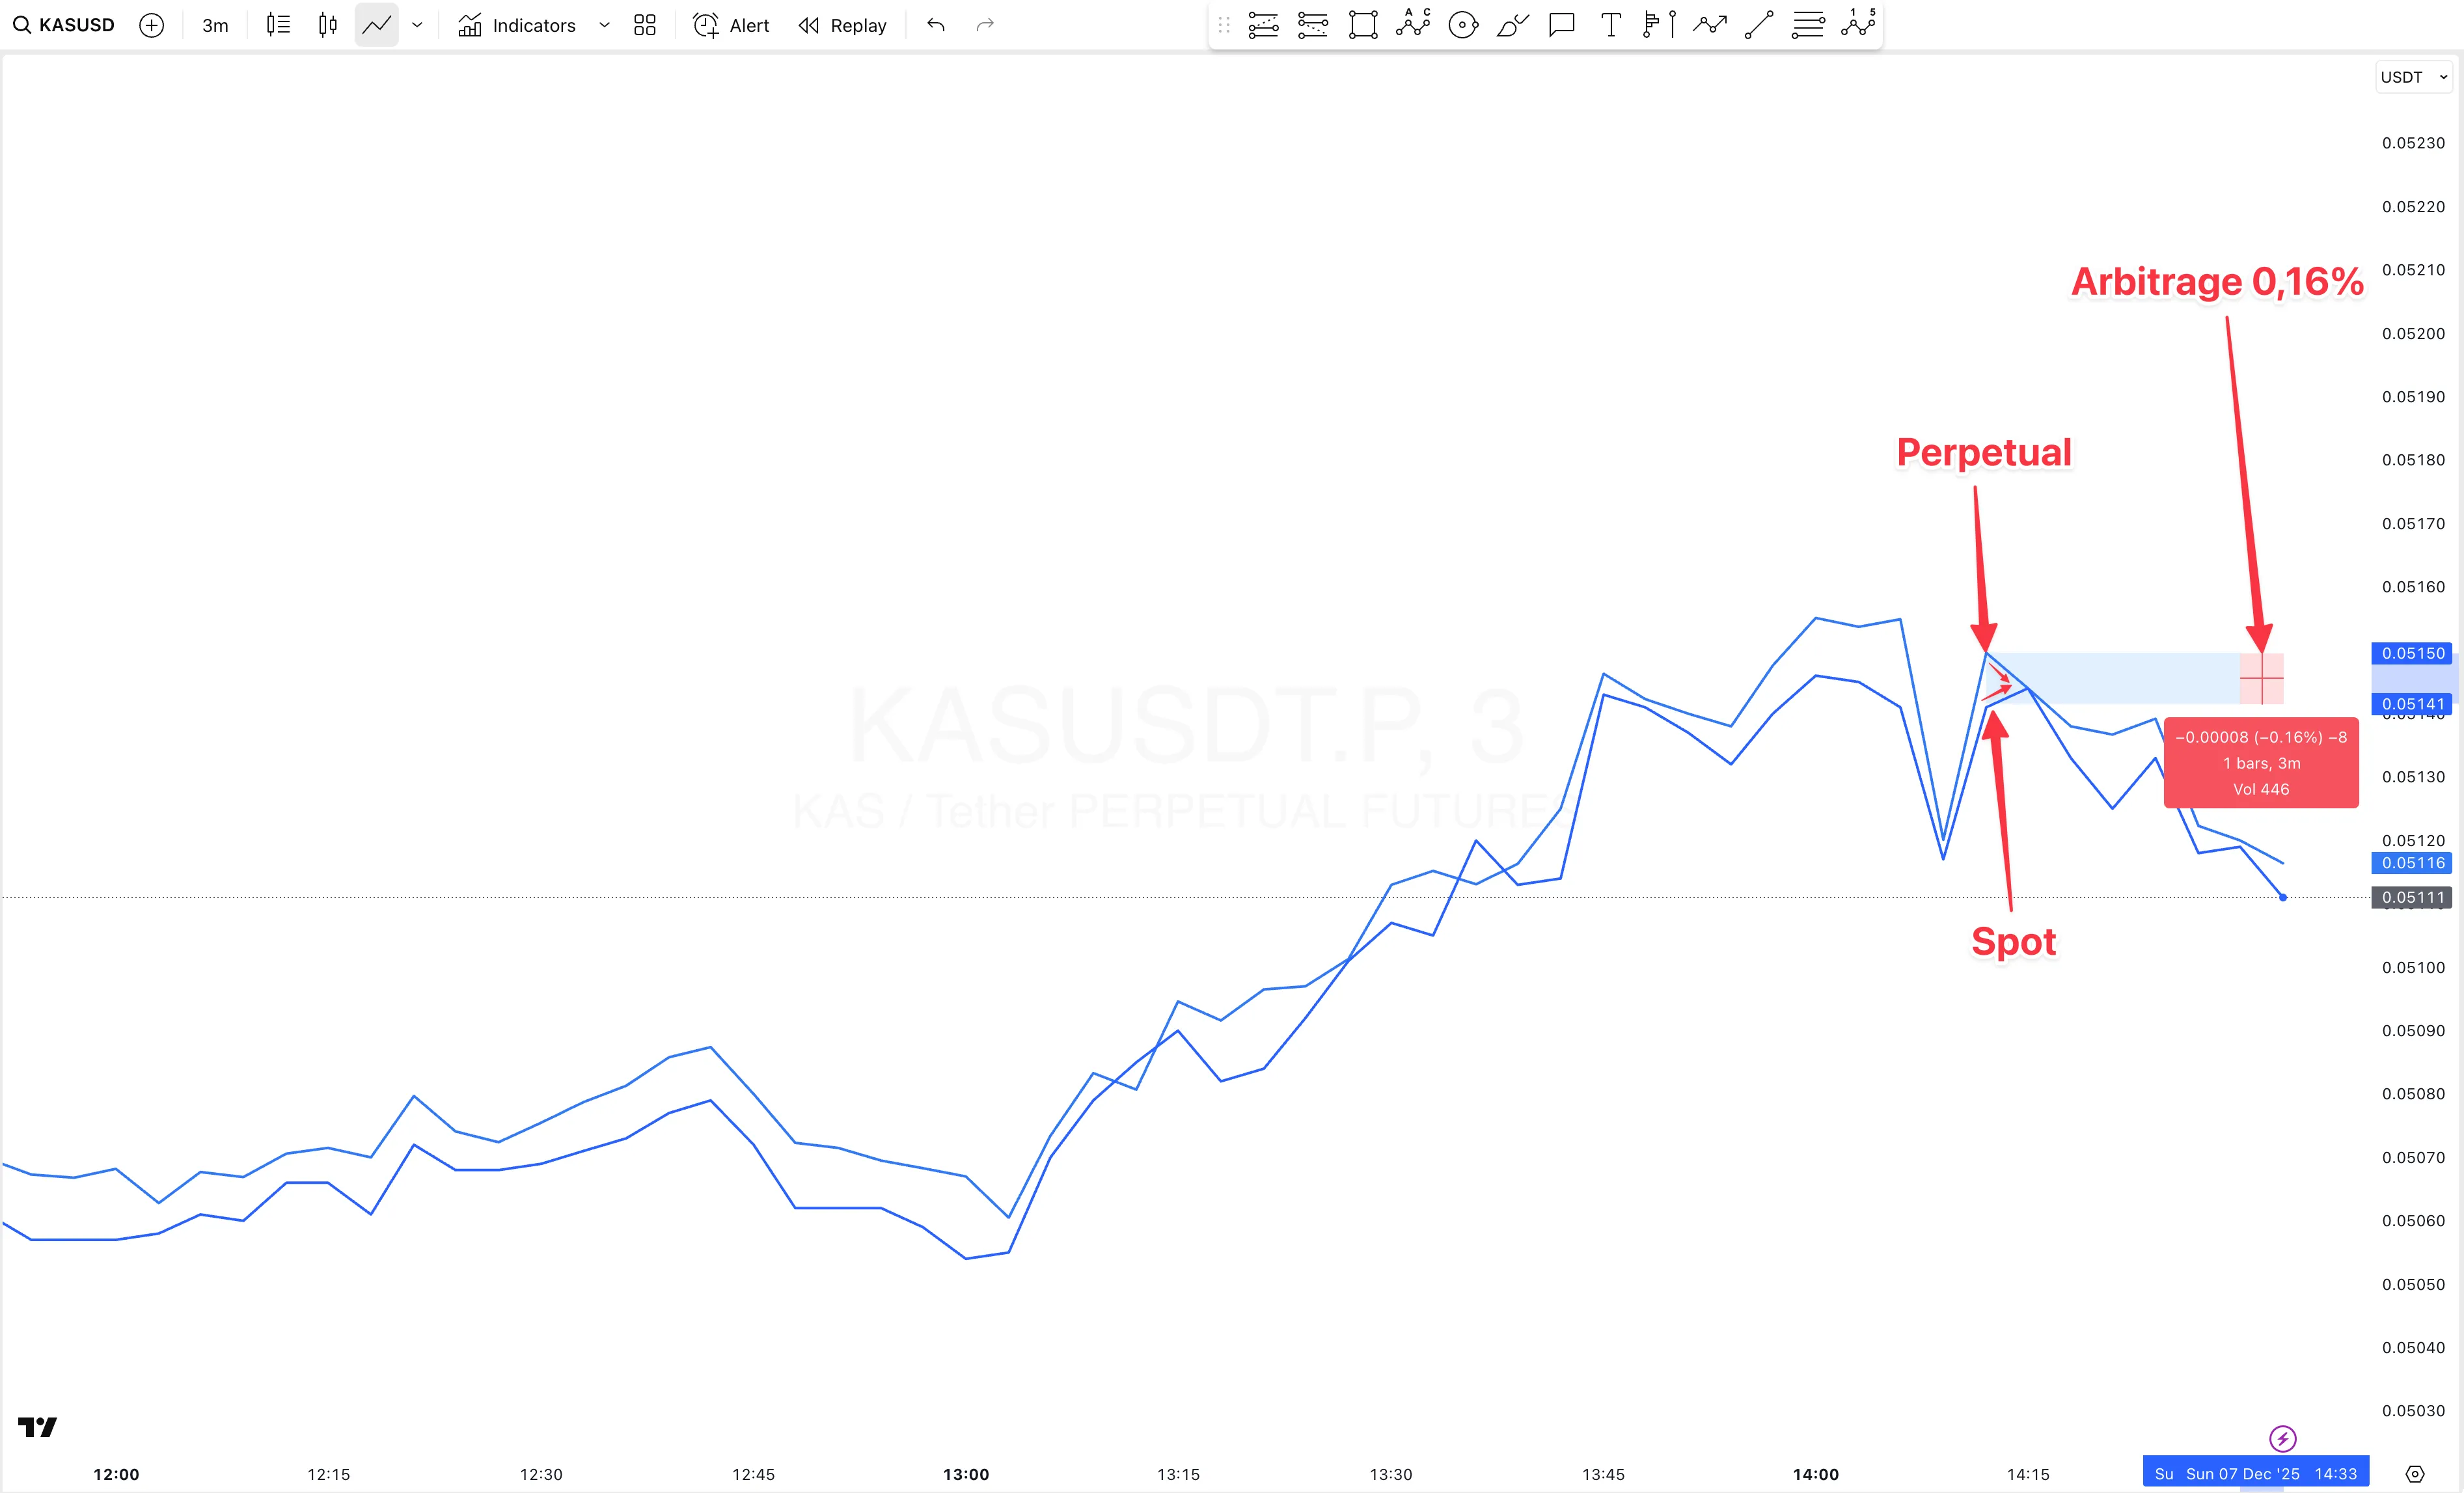
Real-world example: This TradingView chart shows KAS spot and perpetual futures prices on a single exchange. Around 14:10-14:15, the perpetual price (upper blue line) spiked above spot (lower blue line), creating a 0.16% arbitrage opportunity. Market makers quickly captured this gap, and the prices converged within minutes. Notice how the divergence is highlighted in the light blue box, and the immediate convergence that follows—this is the arbitrage mechanism in action.
A Simple Analogy: Apples at Different Stores
Think of this like apples being sold at different prices at two stores across town. If Store A sells apples for $1.00 and Store B sells them for $1.05, an arbitrageur would immediately buy apples at Store A and sell them at Store B, making $0.05 per apple. Their buying activity at Store A would push prices up (increased demand), while their selling activity at Store B would push prices down (increased supply), until both stores converge on the same price—perhaps $1.02.
In cryptocurrency markets, market makers are like professional arbitrageurs with superpowers: they can trade instantly across multiple “stores” (exchanges), they have access to the best prices, they pay lower fees, and they operate automated systems that never sleep. While a regular person might notice the price difference and think about driving across town, market makers have already completed the trade and moved on to the next opportunity.
The key difference is that in crypto markets, you don’t need to physically move apples—you can short one market and long another simultaneously, creating a hedged position that locks in profit regardless of which direction prices move. This makes arbitrage even faster and more efficient than the physical world analogy.
Why Arbitrage Requires Large Capital
Arbitrage opportunities, even when they exist, require significant capital to capture meaningful profits. If the price gap is $0.002 per coin and you want to make $100, you need to trade 50,000 coins, which at $0.051 per coin requires $2,550 in capital just for the spot side (plus margin for the futures side). For market makers operating at scale, they need millions or tens of millions in capital to capture these opportunities consistently.
Large capital is also necessary because arbitrage opportunities are small and frequent. To make significant profits, you need to capture many small opportunities, which requires having capital deployed across many positions simultaneously. Market makers maintain large capital reserves specifically for this purpose, allowing them to capture opportunities that smaller traders cannot.
Additionally, large capital provides safety margins. Even in hedged arbitrage positions, there’s always some risk—execution risk, counterparty risk, or temporary price movements that could create losses before positions can be closed. Large capital allows market makers to weather these risks and continue operating profitably.
Why Execution Speed is Critical
Execution speed is perhaps the most critical factor in successful arbitrage. Price gaps can disappear within milliseconds, so the ability to detect opportunities and execute trades instantly is essential. Market makers use colocated servers—physical servers located in the same data centers as exchange servers—to minimize latency. A few milliseconds of delay can mean the difference between capturing an opportunity and missing it entirely.
Retail traders, even with fast internet connections, face significant latency disadvantages. By the time their order travels from their computer to the exchange, gets processed, and executes, market makers have already captured the opportunity. This speed advantage is so significant that retail traders essentially cannot compete in the arbitrage game.
Market makers also use sophisticated order routing systems that can split large orders across multiple exchanges simultaneously, execute complex multi-leg trades atomically, and cancel or modify orders instantly based on changing market conditions. These systems are far beyond what retail traders can access or afford.
Why Preferential Fees Matter
Market makers receive preferential fee structures from exchanges. Instead of paying fees like retail traders, they often receive rebates—exchanges pay them for providing liquidity. These rebates can turn small arbitrage profits into meaningful returns. For example, if a market maker captures a $0.002 arbitrage opportunity and pays 0.1% in fees, they might only net $0.0018. But if they receive a 0.02% rebate instead, they net $0.0022—a significant difference when scaled across thousands of trades.
Retail traders, on the other hand, pay standard taker fees (typically 0.1-0.2% on most exchanges). These fees often eliminate any potential profit from arbitrage opportunities. If the price gap is $0.002 but fees are $0.0025, the opportunity is actually a loss, not a profit. This is why retail traders cannot profitably capture arbitrage even when they notice price differences.
The fee structure creates a fundamental asymmetry: market makers can profit from smaller price gaps because they pay less (or receive rebates), while retail traders need larger gaps to overcome their fee disadvantage. Since market makers capture small gaps instantly, larger gaps rarely form, leaving retail traders with no profitable opportunities.
Why Automation is Essential
Arbitrage opportunities appear and disappear so quickly that human traders cannot react fast enough. Market makers use fully automated systems that monitor markets 24/7, detect opportunities instantly, calculate optimal trade sizes, execute trades across multiple exchanges simultaneously, and manage risk—all without human intervention. These systems can process thousands of market data updates per second and make trading decisions in microseconds.
Retail traders, even those using automated tools, cannot match this level of sophistication. The algorithms used by professional market makers are proprietary, constantly updated, and backed by teams of quantitative researchers and engineers. They incorporate machine learning, real-time risk management, and complex execution strategies that are far beyond what individual traders can develop or access.
Automation also allows market makers to operate at scale. While a human trader might capture one arbitrage opportunity per day, an automated system can capture hundreds or thousands. This scale is necessary to generate meaningful profits from the tiny margins available in arbitrage.
Why Gaps Disappear Within Milliseconds
Price gaps disappear within milliseconds because thousands of automated systems operated by market makers are constantly monitoring markets and competing to capture opportunities. When a gap appears, it’s not just one market maker that notices—hundreds or thousands of systems detect it simultaneously and all rush to trade. This competition ensures that gaps are closed almost instantly.
The speed of this convergence is so fast that it’s essentially invisible to human observation. By the time a retail trader sees a price difference on their screen, dozens of market makers have already traded to eliminate it. This is why retail traders should focus on understanding the mechanism rather than trying to capture opportunities—the opportunities are gone before they can act.
This rapid convergence is actually beneficial for market efficiency. It ensures that prices stay aligned across markets, preventing sustained arbitrage opportunities that would indicate market inefficiency. However, it also means that the profits from this mechanism are captured almost exclusively by professional market makers with the necessary infrastructure and capital.
The Speed of Convergence
Price gaps between spot and futures markets typically disappear within milliseconds as automated market maker systems compete to capture arbitrage opportunities. Retail traders rarely see these opportunities because they’re arbitraged away before human reaction is possible. Understanding this mechanism is more valuable than trying to capture the opportunities yourself.
4.How Market Makers Stay Risk-Neutral
Market makers operate with a fundamental principle: they don’t want exposure to directional price moves. They want to profit from market inefficiencies, spreads, and arbitrage opportunities while remaining neutral to whether prices go up or down. This risk-neutral approach is achieved through delta hedging, and understanding it reveals how market makers can profit without taking directional risk.
The Concept of Delta Neutrality
Delta neutrality means maintaining a portfolio where the overall price sensitivity (delta) is zero. If you’re long $100,000 worth of futures and short $100,000 worth of spot, your net exposure is zero—price movements in one direction are offset by movements in the other direction. This is the core principle behind market maker risk management.
When market makers engage in arbitrage, they’re not betting on price direction. They’re betting that prices will converge, which is a much safer bet than directional speculation. If KAS spot is $0.051 and futures are $0.053, market makers don’t care whether the final price is $0.050 or $0.054—they just need the two prices to converge so they can unwind their hedged positions at a profit.
This delta-neutral approach allows market makers to operate with much lower risk than directional traders. While a directional trader might lose money if their price prediction is wrong, a delta-neutral market maker only loses money if something goes wrong with their execution, their counterparty, or if prices diverge further before they can close their positions (which is rare due to their speed advantage).
When They Short Futures, They Must Buy Spot
When market makers identify that futures are overpriced relative to spot, they short futures and simultaneously buy spot. This creates a hedged position: if prices go up, they profit on their spot position and lose on their futures short (net zero). If prices go down, they profit on their futures short and lose on their spot position (net zero). But if the prices converge (which is what they’re betting on), they profit from the convergence regardless of the overall price direction.
This hedging is not optional—it’s essential for risk management. A market maker who shorts futures without buying spot would have directional exposure, which is exactly what they’re trying to avoid. The spot purchase is what makes the position delta-neutral and allows them to profit from convergence without taking directional risk.
The scale of this hedging activity is enormous. Every time market makers take positions in futures markets, they create corresponding positions in spot markets to hedge. This constant hedging activity is what creates the tight correlation between futures and spot prices and why spot prices follow futures movements so closely.
When They Long Futures, They Must Sell Spot
Conversely, when market makers identify that futures are underpriced relative to spot, they long futures and simultaneously sell spot. Again, this creates a delta-neutral position where they profit from convergence regardless of overall price direction. The spot sale hedges their futures long position, ensuring they have no net directional exposure.
This bidirectional hedging means that market makers are constantly trading between futures and spot markets, creating continuous flows that keep prices aligned. When futures move up, market makers buy spot to hedge their futures longs, pushing spot up. When futures move down, market makers sell spot to hedge their futures shorts, pushing spot down. This is the mechanism by which futures lead spot.
The hedging flows are so significant that they often dominate spot market activity. Much of what appears to be “spot buying” or “spot selling” is actually market makers hedging their futures positions, not genuine spot market demand or supply. This is why spot prices can move dramatically even when there’s little actual spot market activity from end users.
Hedging Removes Directional Risk While Preserving Profit Mechanisms
The elegant aspect of delta-neutral hedging is that it removes directional risk while preserving all the profit mechanisms that market makers rely on. They can still profit from arbitrage (price convergence), funding rates (periodic payments), spreads (bid-ask differences), and maker rebates (liquidity provision rewards) without taking any directional exposure.
This is why market makers can operate profitably in both bull and bear markets. They don’t need prices to go in a specific direction—they just need markets to function, spreads to exist, and arbitrage opportunities to appear (which they do constantly). Their profitability comes from market structure, not market direction.
Retail traders, on the other hand, typically need to predict price direction correctly to profit. This creates a fundamental asymmetry: market makers profit from market structure regardless of direction, while retail traders must predict direction correctly, which is much harder and riskier.
Why “Exposure Returns to Zero, But Profit Does Not”
This phrase captures the essence of delta-neutral market making. When market makers create hedged positions, their directional exposure is zero—price movements don’t affect their net position value. However, their profit mechanisms remain active. They still capture arbitrage spreads, collect funding payments, earn maker rebates, and profit from bid-ask spreads.
For example, imagine a market maker shorts futures at $0.053 and buys spot at $0.051, locking in a $0.002 arbitrage spread. If prices converge to $0.052, they can unwind both positions. Their exposure was zero (hedged), but they captured the $0.002 profit. The exposure returned to zero (they closed both positions), but the profit remained.
This is the key insight: market makers don’t need directional exposure to profit. They profit from market inefficiencies, structural advantages, and providing services (liquidity) that markets need. Their risk-neutral approach allows them to capture these profits consistently without the volatility and uncertainty that directional traders face.
Understanding this concept helps explain why market makers are so profitable and why retail traders cannot easily replicate their strategies. The infrastructure, capital, speed, and fee advantages that market makers enjoy are what allow them to profit while staying risk-neutral—advantages that retail traders simply don’t have access to.
Risk-Neutral Profitability
Market makers profit from market structure and inefficiencies while maintaining delta-neutral positions that eliminate directional risk. Their exposure returns to zero through hedging, but their profit mechanisms (arbitrage, funding, spreads, rebates) remain active. This allows them to profit consistently regardless of market direction.
5.All Revenue Streams Market Makers Use
Market makers generate profits through multiple sophisticated revenue streams. Understanding each of these mechanisms reveals how professional trading firms can be profitable even when individual trades have tiny margins. The key is scale, speed, and structural advantages that allow these small profits to compound into significant returns.
5.1.Arbitrage Profits
Arbitrage profits come from capturing price differences between correlated markets. When spot and perpetual futures prices diverge, market makers can lock in guaranteed profits by simultaneously taking opposite positions in both markets. The profit is the price difference minus fees, and it’s essentially risk-free because the positions are hedged against each other.
For example, if KAS spot is trading at $0.051 and perpetual futures are trading at $0.053, a market maker can short futures at $0.053 and buy spot at $0.051, locking in a $0.002 spread per coin. If they trade 100,000 coins, that’s $200 in profit (minus fees, but market makers often receive rebates that reduce or eliminate fees). This profit is guaranteed regardless of whether the final price is $0.050 or $0.054—they just need the prices to converge, which happens automatically through arbitrage pressure.
The key to profitable arbitrage is speed and scale. Price gaps are tiny (often just a few basis points) and disappear within milliseconds. Market makers need automated systems that can detect opportunities instantly, execute trades across multiple exchanges simultaneously, and operate 24/7 to capture these fleeting opportunities. When executed thousands of times per day with large volumes, these tiny profits compound into significant revenue.
Market makers also engage in cross-exchange arbitrage, where the same asset trades at different prices on different exchanges. They buy on the cheaper exchange and sell on the more expensive one, capturing the spread. This requires maintaining accounts and capital on multiple exchanges, sophisticated order routing systems, and the ability to move funds quickly between exchanges.
The arbitrage revenue stream is particularly valuable because it’s relatively low-risk (hedged positions) and provides consistent opportunities. As long as markets have slight inefficiencies (which they always do due to latency, information asymmetry, and fragmented liquidity), arbitrage opportunities will exist. Market makers’ infrastructure advantages ensure they capture most of these opportunities before retail traders can react.
5.2.Funding Rate Income
Funding rate income comes from the periodic payments in perpetual futures markets. Every 8 hours (or whatever interval the exchange uses), traders holding long positions pay funding fees to traders holding short positions (or vice versa, depending on whether perpetuals are trading above or below spot). Market makers often position themselves to collect these funding payments while maintaining delta-neutral exposure.
During bullish markets, perpetual futures often trade above spot prices, creating positive funding rates where longs pay shorts. Market makers can short perpetual futures (collecting funding) while buying spot to hedge, creating a delta-neutral position that earns funding income. If funding rates are 0.1% per 8 hours (approximately 1.1% per day annualized), a market maker with $10 million in short perpetual positions could earn $110,000 per day in funding payments while maintaining zero directional exposure through spot hedging.
The funding rate mechanism ensures that perpetual prices track spot prices, but there’s often a small premium or discount that creates funding payments. Market makers exploit this by positioning themselves on the “funding-favorable” side—usually short during bullish markets (when funding is positive) and long during bearish markets (when funding is negative). They collect funding payments regularly while their hedging ensures they have no directional risk.
Funding rates can be highly profitable during extreme market conditions. When sentiment is extremely bullish and many traders rush into long positions, funding rates can spike to 0.5% or even 1% per 8 hours. Market makers who are positioned to collect these high funding rates can generate substantial income. However, they must carefully manage their positions because high funding rates also indicate high market stress and potential volatility.
The sophistication of funding rate strategies involves predicting funding rate movements, managing positions across multiple exchanges (which may have different funding rates), and timing entries and exits to maximize funding collection while minimizing risk. Market makers use algorithms that continuously monitor funding rates, calculate optimal position sizes, and adjust hedges to maintain delta neutrality while maximizing funding income.
5.3.Exchange Maker Rebates (Liquidity Provider Rewards)
Exchange maker rebates are payments that exchanges make to market makers for providing liquidity. Instead of paying fees like retail traders, professional market makers often receive negative fees—exchanges pay them for placing limit orders that add liquidity to order books. These rebates can turn small trading profits into meaningful returns and are a crucial component of market maker profitability.
The rebate structure varies by exchange, but professional market makers typically receive 0.01% to 0.05% rebates on maker orders (limit orders that add liquidity). This means that when a market maker places a limit order that gets filled, they not only capture the spread but also receive a rebate from the exchange. For a market maker trading $100 million per day, even a 0.02% rebate represents $20,000 per day in additional revenue.
These rebates exist because exchanges need liquidity providers. Without market makers continuously quoting both sides of the order book, spreads would be wider, markets would be less efficient, and trading would be more expensive for all participants. Exchanges compete for market maker business by offering attractive rebate programs, knowing that professional liquidity provision improves their platform’s quality and attracts more traders.
Retail traders, in contrast, typically pay taker fees (0.1% to 0.2% on most exchanges) when they place market orders that remove liquidity. This fee asymmetry is significant: market makers might receive a 0.02% rebate while retail traders pay a 0.15% fee, creating a 0.17% advantage for market makers on every round-trip trade. This advantage compounds across thousands of trades, creating substantial profitability differences.
The rebate system creates a structural advantage that retail traders cannot overcome. Even if a retail trader could match market makers’ execution speed and capital, they would still face the fee disadvantage. Market makers can profit from smaller spreads because they receive rebates, while retail traders need larger spreads to overcome their fee burden. Since market makers capture small spreads instantly, larger spreads rarely form, leaving retail traders with no profitable opportunities.
5.4.Spread Capture
Spread capture is the practice of profiting from the difference between bid and ask prices. Market makers continuously quote both sides of the order book—they place buy orders (bids) slightly below the market price and sell orders (asks) slightly above the market price. When both orders get filled, they capture the spread as profit.
For example, if KAS is trading around $0.051, a market maker might place a bid at $0.05100 and an ask at $0.05105. If a buyer comes in and takes their ask at $0.05105, and then a seller comes in and takes their bid at $0.05100, the market maker has captured a $0.00005 spread (5 basis points) on the round trip. When executed thousands of times per day with large volumes, these micro-spread profits accumulate into significant revenue.
The key to profitable spread capture is maintaining tight spreads while ensuring both sides get filled frequently. Market makers use sophisticated algorithms that adjust their bid and ask prices based on market conditions, volatility, inventory levels, and competition from other market makers. They aim to quote the tightest possible spreads that still allow them to profit after accounting for fees (or rebates), risk, and capital costs.
Spread capture works particularly well in liquid markets with high trading volume. More volume means more opportunities for both sides of the spread to get filled. Market makers often focus on the most liquid trading pairs and exchanges because that’s where spread capture is most profitable. They may also adjust their spreads based on time of day, volatility, and market events to optimize profitability.
The scale of spread capture is enormous. Professional market makers might place millions of limit orders per day across multiple exchanges and trading pairs. Even if only a fraction of these orders get filled, the cumulative spread capture across all filled orders generates substantial revenue. Combined with maker rebates, spread capture can be highly profitable even when individual spreads are tiny.
Retail traders cannot effectively compete in spread capture because they lack the infrastructure, capital, and fee advantages that market makers enjoy. By the time a retail trader places a limit order, market makers have already adjusted their quotes, and the spread opportunity may be gone. Additionally, retail traders pay fees that eliminate profitability on small spreads, while market makers receive rebates that enhance profitability.
5.5.Inventory Advantages
Inventory advantages refer to the opportunities that arise from managing positions and capital across multiple markets and timeframes. While market makers aim to stay delta-neutral overall, they can accumulate or offload inventory opportunistically, creating profitable opportunities even while maintaining market-neutral exposure.
Market makers often hold inventory (actual coins or futures positions) that they can deploy strategically. For example, if they anticipate increased buying pressure, they might accumulate spot inventory in advance, allowing them to sell at better prices when demand arrives. Conversely, if they anticipate selling pressure, they might reduce inventory to avoid being caught with excess positions during a downturn.
These inventory management strategies create slight imbalances that can be profitable. A market maker might be slightly long spot and slightly short futures (overall delta-neutral) but positioned to benefit from specific market conditions. If spot prices rise relative to futures (narrowing the basis), they profit. If futures rise relative to spot (widening the basis), they might adjust their inventory to maintain profitability.
Inventory advantages also come from cross-exchange positioning. Market makers maintain inventory on multiple exchanges, allowing them to take advantage of temporary price differences. If one exchange has higher demand, they can sell inventory there while buying on another exchange to replenish, capturing the price difference while maintaining overall inventory levels.
The sophistication of inventory management involves predicting short-term price movements, understanding order flow patterns, and timing inventory adjustments to maximize profitability. Market makers use algorithms that continuously monitor their inventory levels, calculate optimal positions, and execute adjustments automatically. This allows them to profit from slight imbalances while maintaining overall delta neutrality.
Inventory advantages are particularly valuable during volatile periods when price dislocations are more common. Market makers can use their inventory to provide liquidity during these periods, earning wider spreads and higher rebates while helping to stabilize markets. Their ability to manage inventory across multiple markets and timeframes gives them advantages that retail traders cannot replicate.
5.6.Execution Priority & Latency Advantages
Execution priority and latency advantages refer to the infrastructure benefits that allow market makers to see opportunities first and execute trades before other participants. These advantages are crucial for capturing arbitrage opportunities, optimizing spread capture, and managing risk effectively.
Colocated servers are physical servers located in the same data centers as exchange servers. This physical proximity reduces latency to microseconds, allowing market makers to receive market data and execute trades faster than any participant with greater physical distance. A few milliseconds of latency advantage can mean the difference between capturing an arbitrage opportunity and missing it entirely.
Market makers also have access to direct market data feeds that provide faster and more detailed information than standard exchange APIs. These feeds include order book updates, trade data, and market events that allow market makers to react to market conditions instantly. Retail traders, using standard APIs with higher latency, see market conditions only after market makers have already reacted.
Execution priority comes from sophisticated order routing systems that can split large orders across multiple exchanges, execute complex multi-leg trades atomically, and cancel or modify orders instantly based on changing market conditions. These systems allow market makers to execute strategies that would be impossible for retail traders, even with similar capital.
The latency advantages extend beyond just speed—they also include the ability to process information faster. Market makers use algorithms that can analyze thousands of market data points per second, identify patterns, calculate optimal trade sizes, and execute decisions in microseconds. This computational advantage allows them to operate strategies that are too complex for human traders or slower automated systems.
These infrastructure advantages are expensive to maintain. Colocated servers, direct market data feeds, sophisticated order routing systems, and high-performance computing infrastructure cost hundreds of thousands or millions of dollars annually. However, for market makers operating at scale, these costs are justified by the profits they enable. Retail traders cannot afford this infrastructure, creating a fundamental competitive disadvantage.
The combination of execution priority and latency advantages means that market makers see and capture opportunities before retail traders can even detect them. By the time a retail trader notices a price gap or arbitrage opportunity, market makers have already traded to eliminate it. This is why understanding market maker strategies is more valuable than trying to replicate them—the infrastructure requirements make replication essentially impossible for individual traders.
6.Why Retail Traders Cannot Replicate MM Profits
Understanding why retail traders cannot replicate market maker profits is crucial for setting realistic expectations and avoiding costly mistakes. The barriers are not just about capital or knowledge—they’re structural, technological, and economic. Recognizing these barriers helps traders focus on strategies that are actually achievable rather than chasing impossible opportunities.
Arbitrage Margins Are Extremely Small
Arbitrage opportunities, when they exist, have margins that are typically just a few basis points (0.01% to 0.05%). For a retail trader to make meaningful profits from arbitrage, they would need to trade very large volumes. For example, capturing a 0.02% arbitrage spread on $10,000 of capital would generate only $2 in profit—hardly worth the effort and risk. To make $100, a retail trader would need to deploy $500,000 in capital, which is beyond most individual traders’ means.
Market makers, with their millions or tens of millions in capital, can profit from these tiny margins because they operate at scale. They might capture hundreds of arbitrage opportunities per day, each with small margins, but the cumulative effect generates significant profits. Retail traders, with limited capital, cannot achieve this scale, making arbitrage unprofitable for them even when opportunities exist.
Additionally, the margins are so small that even small execution delays or fee differences can eliminate profitability. A retail trader might identify a 0.03% arbitrage opportunity, but by the time they execute (accounting for latency), the opportunity might have shrunk to 0.01%, and after paying 0.15% in fees on each side, they actually lose money on the trade. Market makers, with their speed and fee advantages, can profit from these same opportunities.
Execution Speed Is Too Slow for Retail
Execution speed is perhaps the most insurmountable barrier for retail traders. Arbitrage opportunities disappear within milliseconds, but retail traders face significant latency. Even with fast internet connections, orders must travel from the trader’s computer to the exchange, get processed, and execute—a process that takes at least tens of milliseconds, often hundreds. By that time, market makers have already captured the opportunity.
Market makers use colocated servers that reduce latency to microseconds. They receive market data and execute trades faster than any retail trader can possibly achieve. This speed advantage is so significant that retail traders essentially cannot compete in time-sensitive strategies like arbitrage. By the time a retail trader sees an opportunity and clicks to execute, it’s already gone.
The speed disadvantage extends beyond just latency. Market makers have sophisticated order routing systems that can execute complex multi-leg trades atomically across multiple exchanges. Retail traders, even with automated tools, cannot match this sophistication. Their execution is slower, less efficient, and more prone to errors or partial fills that eliminate profitability.
Fees Eliminate Potential Profit
Retail traders pay standard taker fees (typically 0.1% to 0.2% on most exchanges) that eliminate profitability from small arbitrage opportunities. If an arbitrage spread is 0.05% but fees are 0.15% on each side (0.30% total), the trade is unprofitable. Market makers, receiving rebates instead of paying fees, can profit from much smaller spreads.
This fee asymmetry is fundamental. Market makers might receive a 0.02% rebate on maker orders, while retail traders pay 0.15% on taker orders. This 0.17% difference might seem small, but when applied to thousands of trades, it represents hundreds of thousands of dollars in additional costs for retail traders and additional revenue for market makers.
The fee structure means that retail traders need much larger price gaps to be profitable, but those larger gaps rarely form because market makers capture smaller gaps instantly. This creates a catch-22: retail traders need opportunities that are large enough to overcome fees, but those opportunities don’t exist because market makers eliminate them before they can grow large enough.
Funding Rates and Hedging Complexity
While funding rates can be profitable for market makers who understand how to position themselves and hedge effectively, they’re complex for retail traders. Market makers use sophisticated algorithms to calculate optimal positions, manage hedges across multiple markets, and time entries and exits to maximize funding collection while maintaining delta neutrality.
Retail traders, attempting to collect funding rates, face several challenges. They must understand how funding rates work, calculate optimal position sizes, maintain proper hedges (which requires capital on both spot and futures markets), and manage the complexity of multi-market positions. Mistakes in hedging can create unintended directional exposure, turning what should be a low-risk strategy into a high-risk gamble.
Additionally, funding rate strategies require significant capital because positions must be hedged. A retail trader wanting to collect funding by shorting $10,000 worth of futures must also buy $10,000 worth of spot to hedge, requiring $20,000 in total capital. Market makers, with their large capital reserves, can operate these strategies at scale, but retail traders often lack sufficient capital to make funding rate strategies worthwhile.
Lack of Multi-Exchange Infrastructure
Effective arbitrage and market making require maintaining accounts, capital, and trading infrastructure across multiple exchanges. Market makers operate on dozens of exchanges simultaneously, allowing them to capture cross-exchange arbitrage opportunities and optimize their strategies across different market conditions and fee structures.
Retail traders typically operate on one or a few exchanges due to the complexity and cost of maintaining multiple accounts. Each exchange requires separate account setup, KYC verification, capital allocation, and ongoing management. This limits retail traders’ ability to capture cross-exchange opportunities and forces them to operate in less efficient, single-exchange environments.
Additionally, moving funds between exchanges takes time and incurs fees. Market makers, with established relationships and infrastructure, can move funds quickly and efficiently. Retail traders face delays and costs that make cross-exchange strategies less viable. By the time a retail trader moves funds to capture an opportunity, it’s often already gone.
Professional Bots Operate Much Faster
Market makers use proprietary algorithms developed by teams of quantitative researchers and engineers. These algorithms incorporate machine learning, real-time risk management, and complex execution strategies that are far beyond what individual traders can develop or access. They process thousands of market data updates per second and make trading decisions in microseconds.
Retail traders, even those using automated tools or commercial trading bots, cannot match this sophistication. Commercial bots are generic, not optimized for specific strategies, and they still face the same latency and fee disadvantages as manual trading. Proprietary algorithms used by market makers are constantly updated, backtested, and optimized—resources that retail traders don’t have access to.
The algorithmic advantage means that market makers can operate strategies that are too complex for retail traders. They can simultaneously monitor hundreds of trading pairs, calculate optimal positions across multiple markets, execute complex multi-leg trades, and manage risk in real-time—all automatically. Retail traders, even with automation, cannot achieve this level of sophistication.
Retail Sees Moves Only After Arbitrage Is Complete
Perhaps the most important point is that retail traders see price movements only after market makers have already captured the arbitrage opportunities. When a price gap appears, market makers trade instantly to capture it, and their trading activity is what causes the prices to converge. By the time retail traders see the price movement on their screens, the arbitrage opportunity is already gone, and they’re just observing the aftermath.
This creates a fundamental information asymmetry. Market makers see opportunities in real-time and act on them immediately. Retail traders see the results of market maker activity—price movements, convergences, and market adjustments—but not the opportunities themselves. This is why retail traders should focus on understanding market structure rather than trying to capture arbitrage—the opportunities are gone before they can react.
Understanding this dynamic helps traders avoid the trap of thinking they can replicate market maker strategies. Instead of trying to capture opportunities that are already gone, traders should focus on understanding how market maker activity affects prices and using that understanding to inform their own trading strategies. This is far more valuable than attempting the impossible task of competing with market makers directly.
The Reality of Retail Trading
Retail traders cannot replicate market maker profits due to structural barriers: tiny arbitrage margins require scale they don’t have, execution speed is too slow, fees eliminate profitability, funding strategies are too complex, multi-exchange infrastructure is lacking, and professional algorithms operate much faster. Understanding market structure is more valuable than trying to compete with market makers directly.
7.Practical Consequences for Price Movement
The interactions between spot markets, perpetual futures markets, and market makers create observable patterns in price movements. Understanding these patterns helps traders interpret market behavior and avoid common misconceptions about what drives prices. These practical consequences are what traders actually experience in real markets.
Spot Wicks Caused by MM Hedging
Spot price charts often show long wicks (the thin lines extending above or below candle bodies) that seem to appear without corresponding volume or news. These wicks are frequently caused by market maker hedging activity. When futures markets move suddenly, market makers must quickly adjust their spot hedges, creating sudden buying or selling pressure that moves spot prices temporarily before they settle back.
For example, if perpetual futures suddenly spike upward due to leveraged buying, market makers who are short futures must quickly buy spot to maintain their delta-neutral hedges. This sudden buying pressure can create a sharp upward wick on the spot chart, even though there’s no corresponding increase in genuine spot market demand. Once the hedging is complete and prices stabilize, the spot price often retraces, leaving just the wick as evidence of the hedging activity.
These wicks can be confusing for traders who are analyzing spot charts in isolation. They might interpret a long upper wick as rejection or selling pressure, when it’s actually just market maker hedging activity responding to futures movements. Understanding that spot wicks often reflect futures market dynamics rather than spot market sentiment helps traders avoid misinterpretation.
The frequency and magnitude of these hedging wicks depend on futures market volatility. During periods of high leverage and futures market activity, spot charts show more wicks as market makers continuously adjust their hedges. During calm periods with low futures activity, spot charts are smoother because there’s less hedging pressure.
Liquidation Hunts Created by Futures Imbalances
Liquidation hunts are coordinated price movements designed to trigger stop-loss orders and liquidate leveraged positions. These hunts are often created by futures market imbalances—when there are many leveraged long positions clustered at a specific price level, market makers or large traders can push prices down to that level, triggering liquidations, which create additional selling pressure and push prices even lower.
The mechanism works because liquidations create forced market orders that must execute immediately, regardless of price. When many positions get liquidated simultaneously, this creates a cascade of selling (or buying) that amplifies the price movement. Market makers, who can see where liquidation clusters exist through order book analysis, can position themselves to profit from these cascades while providing liquidity during the volatile period.
These liquidation hunts often start in futures markets because that’s where leverage is concentrated. A price movement that triggers liquidations in futures creates additional selling pressure, which market makers hedge by selling spot, which pushes spot prices down and can trigger more liquidations. This creates a feedback loop where futures imbalances create spot price movements through hedging flows.
Understanding liquidation dynamics helps traders avoid being caught in these hunts. By recognizing where large liquidation clusters exist (often visible through open interest data and funding rate analysis), traders can avoid placing stop-loss orders at those levels or can position themselves to benefit from the volatility rather than being victimized by it.
Futures Leading Market Reversals
Market reversals—when prices change direction from up to down or vice versa—often start in futures markets before appearing in spot markets. This happens because futures markets have more leverage, more active traders, and faster reaction to changing conditions. When sentiment shifts, the first reactions appear in futures markets, and spot markets follow through arbitrage and hedging flows.
For example, if a bullish trend is losing momentum, leveraged long positions in futures markets might start getting liquidated or closed, creating selling pressure. This selling pressure in futures creates arbitrage opportunities (futures become cheaper relative to spot), which market makers capture by buying futures and selling spot. This hedging activity pushes spot prices down, creating the appearance of a spot market reversal, but the reversal actually started in futures.
Traders who focus only on spot charts might miss early reversal signals that are visible in futures markets. By monitoring futures price action, open interest changes, and funding rate shifts, traders can often detect reversals earlier than those who only watch spot markets. This early detection can be valuable for risk management and position timing.
The futures-first reversal pattern is particularly pronounced during volatile periods when leverage amplifies movements. During these periods, futures markets can reverse sharply while spot markets lag, creating temporary price divergences that arbitrage quickly closes. Understanding this pattern helps traders interpret market movements more accurately.
Price Snaps Caused by Rebalancing
Price snaps are sudden, sharp price movements that occur when market makers rebalance their positions or when large arbitrage trades execute. These snaps can happen when market makers adjust their hedges, when funding rates change significantly, or when cross-exchange arbitrage opportunities are captured. The sudden execution of large hedged trades can move prices temporarily before they settle.
For example, if funding rates shift dramatically, market makers might need to quickly adjust their positions to maintain optimal funding collection. This rebalancing can involve large trades executed simultaneously across spot and futures markets, creating sudden price movements. These movements are often temporary—prices snap to a new level and then stabilize as the rebalancing completes.
Price snaps can be confusing for traders because they appear to happen without obvious cause. There’s no news, no large retail order, and no clear reason for the sudden movement. Understanding that these snaps are often caused by market maker rebalancing helps traders avoid overreacting to what might be temporary movements rather than genuine trend changes.
The frequency of price snaps depends on market conditions. During periods of high volatility or significant funding rate changes, rebalancing is more frequent and snaps are more common. During calm periods, rebalancing is smoother and snaps are less noticeable. Traders should be aware that not every price movement represents genuine market sentiment—some are just structural rebalancing.
Why Spot Sometimes Moves Without Spot Volume
A common observation that confuses traders is seeing spot prices move significantly even when spot trading volume is low. This happens because much of what appears to be “spot trading” is actually market maker hedging activity, not genuine spot market demand or supply. Market makers trade spot to hedge their futures positions, creating price movements without corresponding increases in actual spot market activity.
For example, if futures markets are very active but spot markets are quiet, market makers might still be trading significant spot volume to hedge their futures exposure. This hedging activity moves spot prices even though there’s little genuine spot market interest. The spot price movement reflects futures market dynamics, not spot market fundamentals.
This creates a disconnect between spot price and spot volume that can be misleading. Traders analyzing volume might conclude that low volume means weak price movements, but they’re missing the hedging flows that are driving prices. Understanding that spot price movements often reflect futures market activity rather than spot market activity helps traders interpret volume data more accurately.
The relationship between spot price and spot volume becomes even more complex during periods of high futures activity. During these periods, spot prices can move dramatically with relatively low spot volume because the price movement is driven by hedging flows rather than genuine spot market supply and demand. This is why analyzing both spot and futures markets together provides better insights than analyzing either in isolation.
These practical consequences—spot wicks from hedging, liquidation hunts from futures imbalances, futures-leading reversals, price snaps from rebalancing, and spot movements without spot volume—all stem from the fundamental relationship between spot and futures markets mediated by market makers. Understanding these patterns helps traders interpret market behavior more accurately and avoid common analytical mistakes.
Interpreting Market Movements
Many observable price patterns—spot wicks, liquidation hunts, futures-leading reversals, price snaps, and spot movements without volume—are caused by the interactions between spot, futures, and market makers rather than genuine supply and demand. Understanding these structural patterns helps traders interpret market behavior more accurately.
8.Educational Conclusion
The relationship between spot markets, perpetual futures markets, and market makers creates a complex but understandable system that drives modern cryptocurrency price discovery. The key insight is elegantly simple: futures create the pressure, market makers rebalance it, and spot reflects it. Understanding this flow helps traders interpret market movements more accurately and avoid common analytical mistakes.
Futures markets, with their higher volume, leverage, and active participant base, typically lead price discovery. When sentiment shifts, news breaks, or large positions change, the first reactions appear in futures markets. This creates price movements and imbalances that market makers must respond to through hedging and arbitrage.
Market makers, operating sophisticated automated systems with significant capital and infrastructure advantages, continuously rebalance the pressure between futures and spot markets. Through arbitrage, they force prices to converge. Through hedging, they link futures movements to spot movements. Through their various revenue streams—arbitrage, funding, rebates, spreads, inventory management, and latency advantages—they profit from market structure while maintaining risk-neutral positions.
Spot markets, while representing actual coin ownership and real transactions, often reflect the price discovery that happens in futures markets. Spot prices follow futures prices through arbitrage and hedging flows, creating the appearance that spot moves independently when it’s actually responding to futures market dynamics. This doesn’t make spot markets irrelevant—they’re still essential for actual ownership and long-term value—but it does mean that for short-term price prediction, futures markets provide more useful leading indicators.
Observing both markets together helps traders understand volatility, identify trends earlier, and interpret price movements more accurately. By monitoring futures price action, open interest, funding rates, and comparing them to spot market activity, traders can gain insights that aren’t available from either market alone. This holistic view reveals the underlying forces driving prices rather than just the price movements themselves.
Tools like kaspa-lens.com are designed to help visualize these relationships. By displaying futures vs. spot divergence, liquidity pressures, market maker hedging flows, liquidation clusters, and open interest behavior, these tools make the invisible forces visible. Traders can see when futures are leading spot, when arbitrage opportunities are being captured, when hedging flows are creating price movements, and when liquidation clusters might trigger volatility.
The purpose of understanding this system is not to replicate market maker strategies—the structural barriers make that essentially impossible for retail traders. Instead, the purpose is to give traders a clearer understanding of market structure so they can make better trading decisions. By understanding how prices actually move, traders can avoid the trap of analyzing markets in isolation, misinterpret price patterns, or attempting strategies that are structurally unprofitable.
This understanding is particularly valuable for risk management. By recognizing that spot wicks might be hedging artifacts rather than genuine rejection, that liquidation hunts are structural rather than random, and that futures often lead reversals, traders can position themselves more effectively and avoid being caught in movements they don’t understand.
The cryptocurrency market microstructure is complex, but it’s not random. The interactions between spot, futures, and market makers follow logical patterns that can be understood and anticipated. While retail traders cannot capture the same opportunities that market makers do, they can use their understanding of market structure to inform their own trading strategies, manage risk more effectively, and interpret market behavior more accurately.
The key takeaway is that modern cryptocurrency markets are a system where futures discover prices, market makers maintain efficiency, and spot reflects the results. Understanding this system doesn’t require trying to compete with market makers—it requires understanding how market makers’ activities affect prices and using that understanding to make better trading decisions. This knowledge is far more valuable than attempting impossible strategies, and it’s accessible to any trader willing to learn.
The Key Insight
Futures create the pressure, market makers rebalance it, and spot reflects it. Understanding this flow helps traders interpret market movements, identify trends earlier, and make better trading decisions. While retail traders cannot replicate market maker strategies, they can use their understanding of market structure to inform their own trading and manage risk more effectively.